EC models possess multilayered architecture, where each layer represents submodel corresponding to a certain level of biodiversity: genetic, metabolic, population, and finally ecosystem (fig. 1). Interfaces between submodels of different layers (input and output data) are specified, but models themselves are not strictly limited and may vary. As the number of organisms (cells) in a prokaryotic community and even in a separate population is rather huge (109-1020), we don’t consider cells as separate objects*. The base object in our model is the polymorphic population which is characterized by its size, generalized genome and substrate-product relations with environment.
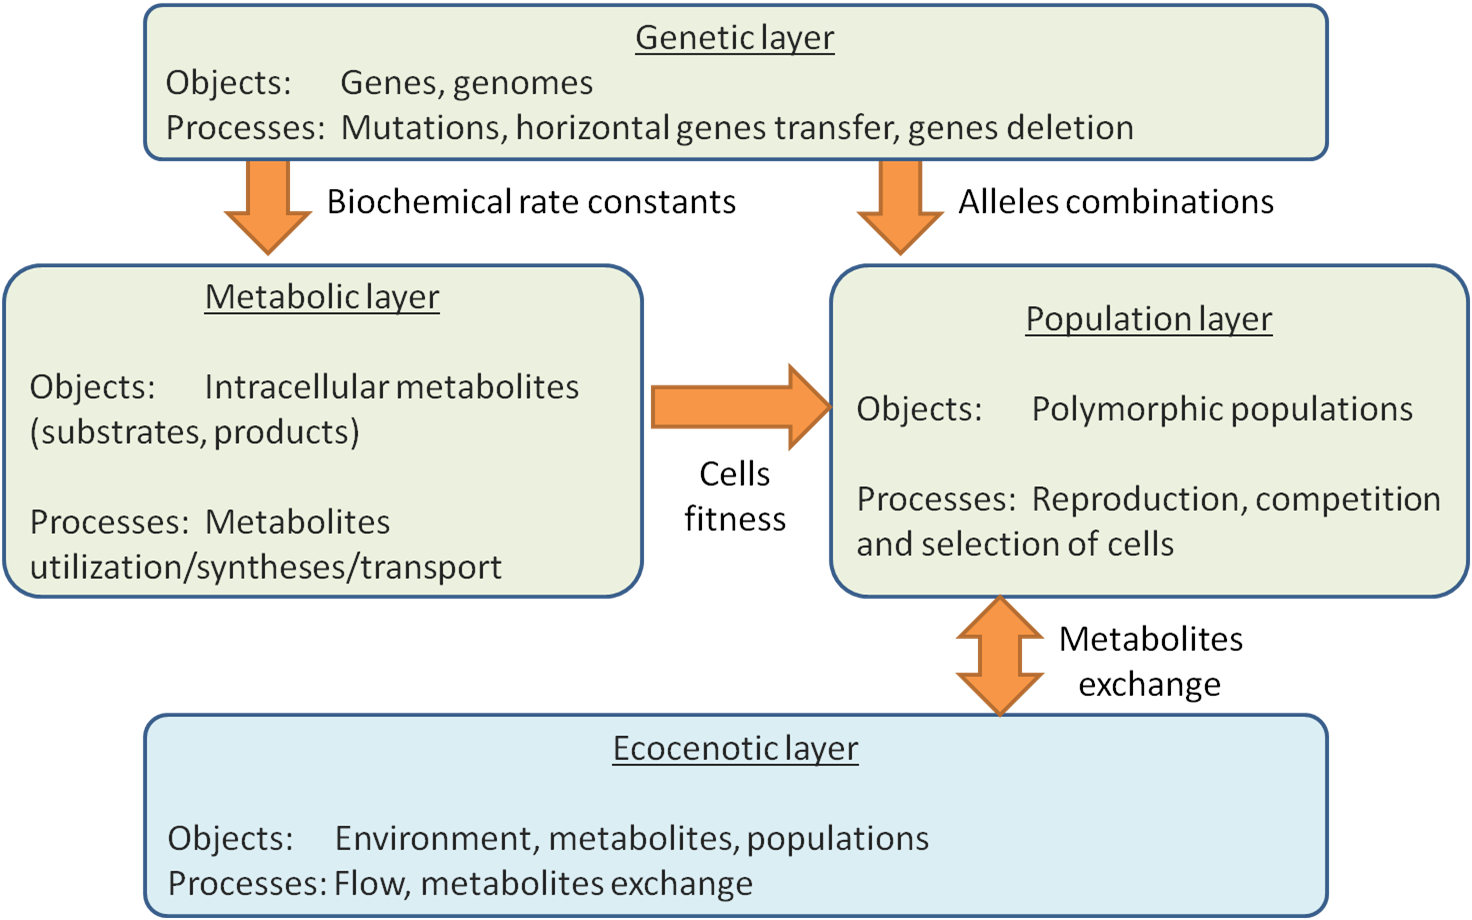
The genetic diversity layer is defined with generalized genome of a population which is to say that all cells in a certain population have the same genes, only alleles vary. The metabolic diversity layer is defined with sets of constants for the following metabolic reactions: substrates utilization, products synthesis and secretion. The set of genes determines reactions specific for a certain population while particular rates of these reactions (rate constants) are noted as alleles of corresponding genes*.
Metabolism determines population growth rate as a function of amounts of substrates which its cells have consumed from environment and/or have synthesized by themselves. In EC population growth rate is calculated using models of trophic strategies: the equations taking into account as well as substrates consumed and constants of utilization (which are defined by corresponding genes), and parameters such as flow rate and death rate. Formulas of trophic strategies were constructed as a matter of experience in our laboratory on construction of models of enzymatic reactions and gene expression regulation (Group of the MGS Modelling). The example of such formula is given below, in Calculation chapter.
The genetic diversity layer is described using the vectors of genetic spectra. Each spectrum defines alleles’ distribution for a certain gene in a population. Special set of operations – genetic spectra arithmetic is used to describe as genetic so ecocenotic diversity. Both the change of population composition in ecosystem, and the change in ecosystem structure and set of components are described with that arithmetic. The change of population composition includes processes of origin and elimination of novel alleles and genes due to mutations. The change in ecosystem structure and set of components is modeled with grouping/ungrouping of spectra of various polymorphic populations. Ecosystem and population levels of biodiversity (new species origin and HGT) are also modeled with genetic spectra arithmetic. Interactions between population and ecocenotic biodiversity layers are also prescribed through the processes of transport of substrate to be utilized (from environment into cell) and transport (secretion) of synthesized products (from cells into environment). It should be noted that secreted products may be used as the substrates for another type cells.
Finally, ecocenotic layer contains a model of environment (biotope) characterized with its volume, inner substrates concentrations and flow rate*. This model describes the process of substrates supply into environment, their outflow and accumulation in environment. There are two ways of substrates supply: inflow from outside (nonspecific substrates), and cells’ synthesis and secretion (specific substrates). Elimination of substrates out of environment is provided with two actions: first is outflow, and second is consumption by cells. If the rate of substrate supply is more than outflow rate, the substrate is accumulating in environment.
EC models possess multilayered architecture, where each layer represents submodel corresponding to a certain level of biodiversity: genetic, metabolic, population, and finally ecosystem (fig. 1). Interfaces between submodels of different layers (input and output data) are specified, but models themselves are not strictly limited and may vary. As the number of organisms (cells) in a prokaryotic community and even in a separate population is rather huge (109-1020), we don’t consider cells as separate objects*. The base object in our model is the polymorphic population which is characterized by its size, generalized genome and substrate-product relations with environment.
The genetic diversity layer is defined with generalized genome of a population which is to say that all cells in a certain population have the same genes, only alleles vary. The metabolic diversity layer is defined with sets of constants for the following metabolic reactions: substrates utilization, products synthesis and secretion. The set of genes determines reactions specific for a certain population while particular rates of these reactions (rate constants) are noted as alleles of corresponding genes*.
Metabolism determines population growth rate as a function of amounts of substrates which its cells have consumed from environment and/or have synthesized by themselves. In EC population growth rate is calculated using models of trophic strategies: the equations taking into account as well as substrates consumed and constants of utilization (which are defined by corresponding genes), and parameters such as flow rate and death rate. Formulas of trophic strategies were constructed as a matter of experience in our laboratory on construction of models of enzymatic reactions and gene expression regulation (Oshchepkova-Nedosekina, Likhoshvai, 2007). The example of such formula is given below, in Calculation chapter.
The genetic diversity layer is described using the vectors of genetic spectra. Each spectrum defines alleles’ distribution for a certain gene in a population. Special set of operations – genetic spectra arithmetic is used to describe as genetic so ecocenotic diversity. Both the change of population composition in ecosystem, and the change in ecosystem structure and set of components are described with that arithmetic. The change of population composition includes processes of origin and elimination of novel alleles and genes due to mutations. The change in ecosystem structure and set of components is modeled with grouping/ungrouping of spectra of various polymorphic populations. Ecosystem and population levels of biodiversity (new species origin and HGT) are also modeled with genetic spectra arithmetic. Interactions between population and ecocenotic biodiversity layers are also prescribed through the processes of transport of substrate to be utilized (from environment into cell) and transport (secretion) of synthesized products (from cells into environment). It should be noted that secreted products may be used as the substrates for another type cells.
Finally, ecocenotic layer contains a model of environment (biotope) characterized with its volume, inner substrates concentrations and flow rate*. This model describes the process of substrates supply into environment, their outflow and accumulation in environment. There are two ways of substrates supply: inflow from outside (nonspecific substrates), and cells’ synthesis and secretion (specific substrates). Elimination of substrates out of environment is provided with two actions: first is outflow, and second is consumption by cells. If the rate of substrate supply is more than outflow rate, the substrate is accumulating in environment.