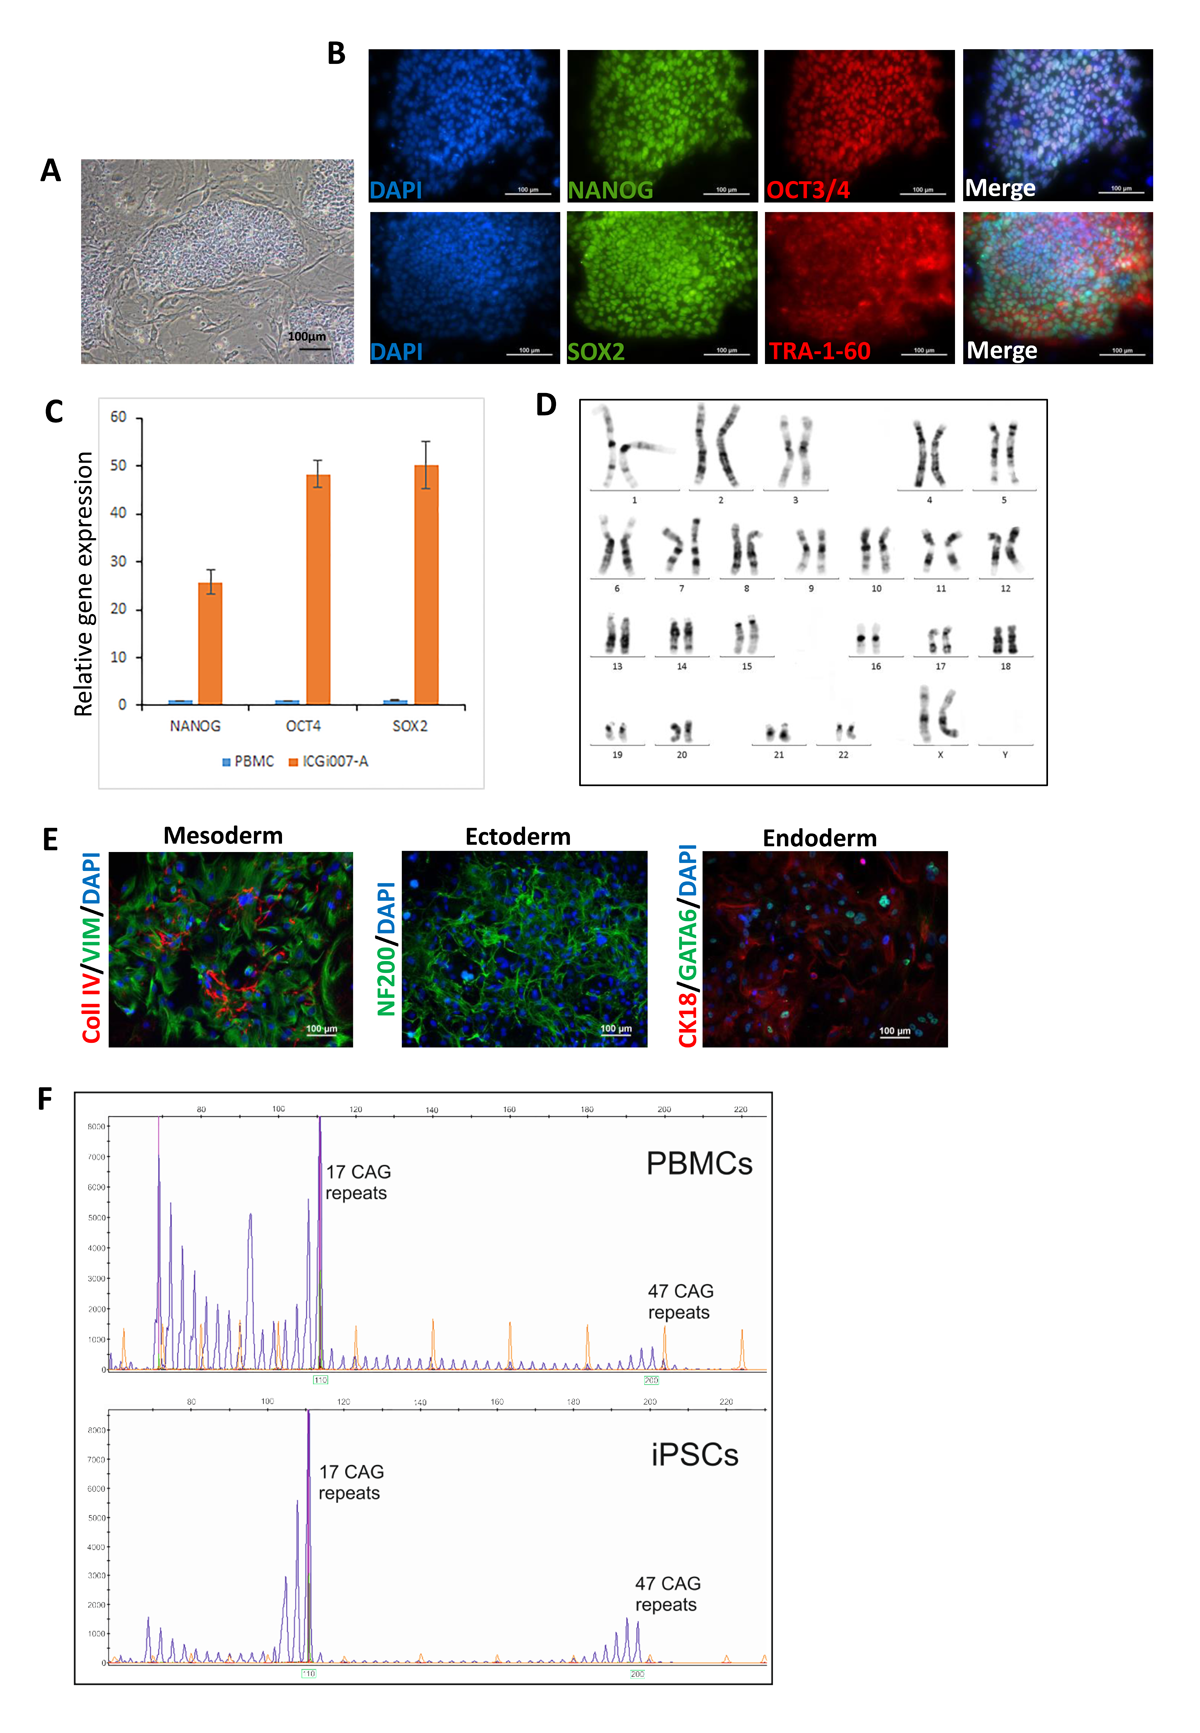
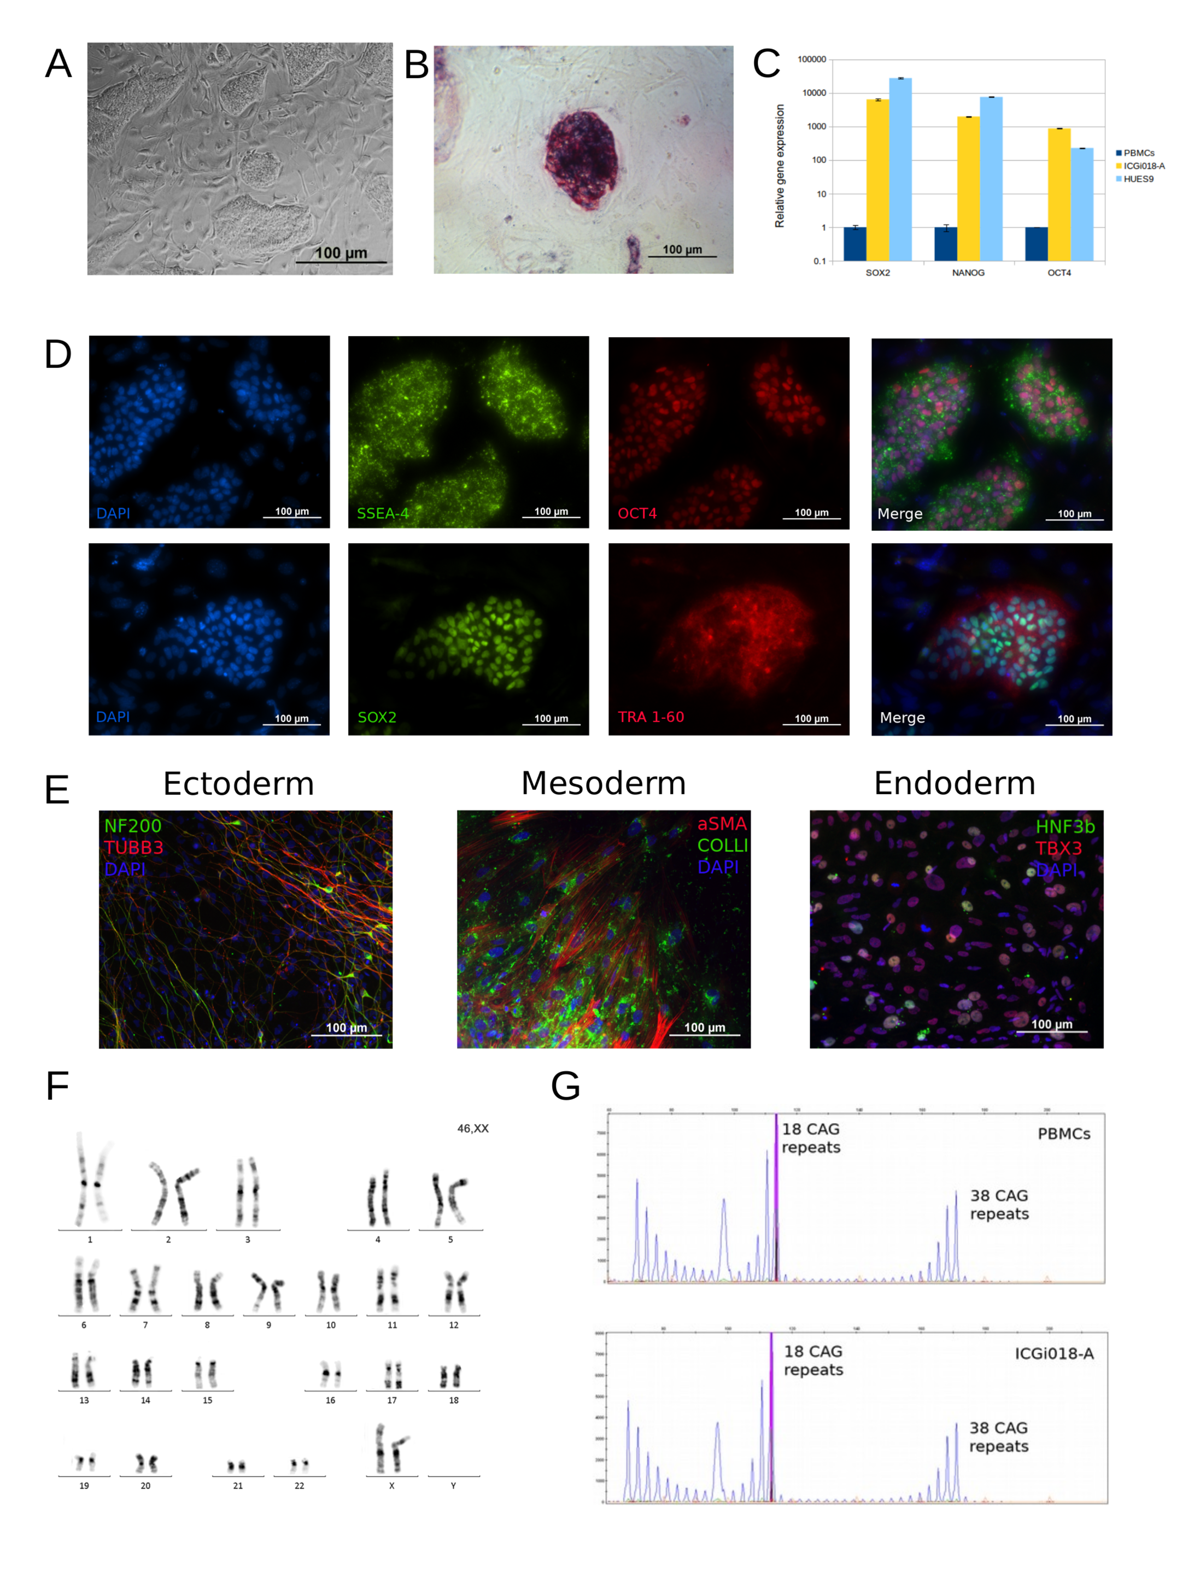
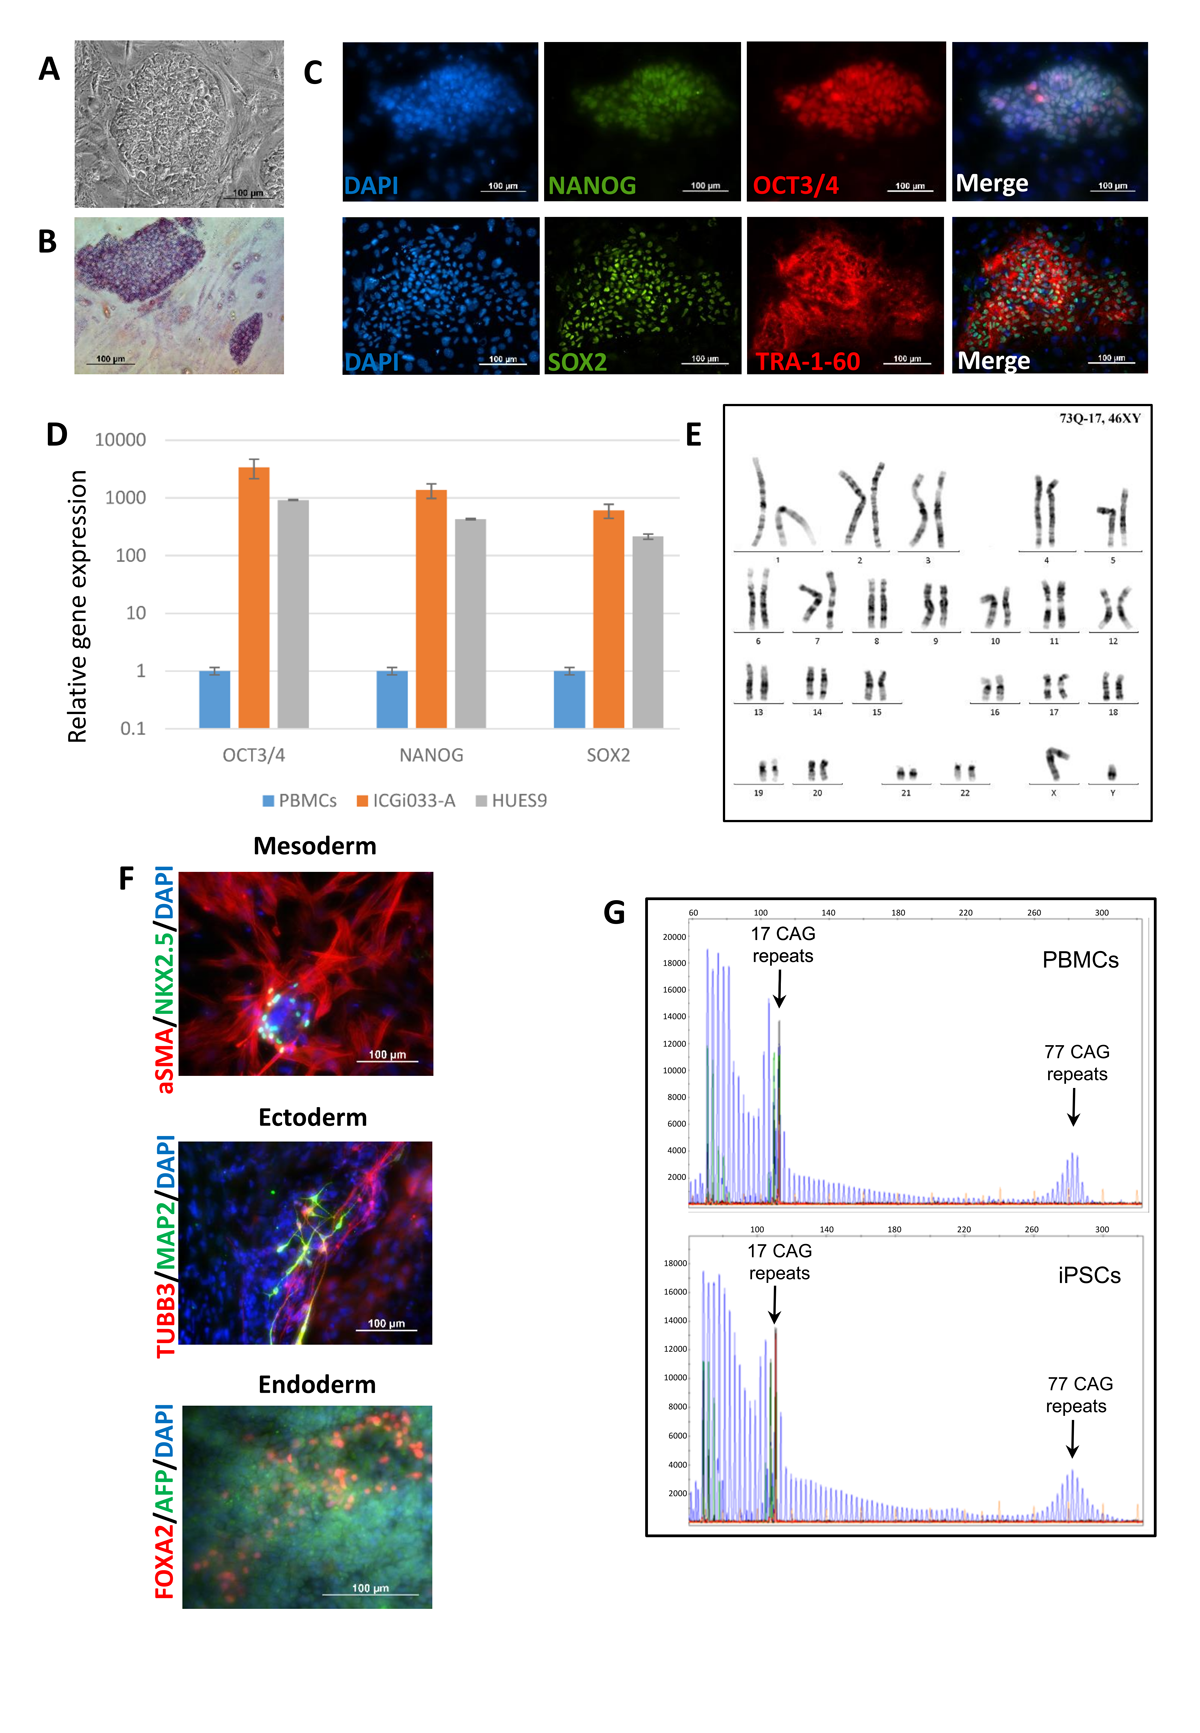
Huntington’s disease (HD) human induced pluripotent stem cells (iPSCs) represent a useful and valid model for the disease study (molecular mechanisms, large-scale drug screening, and toxicological studies). iPSC lines ICGi007-A (https://hpscreg.eu/cell-line/ICGi007-A), ICGi018-A (https://hpscreg.eu/cell-line/ICGi018-A) and ICGi033-A (https://hpscreg.eu/cell-line/ICGi033-A) from HD patients with 47,38 and 77 CAG triplets respectively in the HTT gene were generated from blood mononuclear cells by non-integrating episomal vectors. The iPSC lines retained the mutation, expressed pluripotency markers, had a normal karyotype and displayed in vitro differentiation to the cell types of the three germ layers.

Diseased iPSC lines - Huntington’s disease (47 CAG)
Characterization of ICGi007-A iPSC cell line. A. Morphology of iPSC colony. B. Immunofluorescence staining for pluripotency markers NANOG, OCT3/4, SOX2, TRA-1-60. C. Quantitative analysis expression of pluripotency markers (NANOG, OCT4, SOX2) by RT-qPCR. D. Karyotype (G-banding) analysis (46, XX). E. Immunofluorescence staining for differentiation markers: VIM and COLL IV (mesoderm); NF200 (ectoderm); CK18 and GATA6 (endoderm). F. DNA fragment analysis of PCR-product detected 17 and 47 CAG repeats in PBMCs and ICGi007-A. All scale bars - 100 μm.
Huntington’s disease (38 CAG)
Characterization of ICGi018-A iPSC cell line.A. Morphology of iPSC colony. B. Alkaline phosphatase staining. C. Quantitative analysis of pluripotency marker expression (SOX2, NANOG, OCT4) by qPCR. D. Immunofluorescence staining for pluripotency markers SSEA-4, OCT4, SOX2 and TRA-1-60. E. In vitro differentiation. Immunofluorescence staining for differentiation markers: NF200 and TUBB3 (ectoderm); aSMA and COLL I (mesoderm); HNF3b and TBX3 (endoderm). F. Karyotype (G-banding) analysis (46, XX). G. DNA fragment analysis of PCR-products detected 18 and 38 CAG repeats in PBMCs and ICGi018-A. All scale bars are 100 µm.
Diseased iPSC lines - Huntington’s disease
Characterization of ICGi033-A iPSC cell line. A. Morphology of iPSC colony. B. Alkaline phosphatase staining. C. Immunofluorescence staining for pluripotency markers NANOG, OCT4, SOX2 and TRA-1-60. D. Quantitative analysis of pluripotency marker expression (OCT4, NANOG, SOX2) by qPCR.E. Karyotype (G-banding) analysis (46, XY). F. In vitro differentiation. Immunofluorescence staining for differentiation markers: MAP2 and TUBB3 (ectoderm); aSMA and NKX 2.5 (mesoderm); FOXA2 and AFP (endoderm). G. DNA fragment analysis of PCR-products detected 17 and 77 CAG repeats in PBMCs and ICGi033-A. All scale bars are 100 µm.